
Owning Microcaps Without Getting Killed
What "I made tons of money anyway" misses about risk, position sizing, and the shape of a portfolio.

There’s a sentence I keep hearing — in the microcap Discord and WhatsApp groups, on X, from people whose stock-picking I genuinely respect. I’ll point out that a position blew up, or that a book is carrying drawdowns that would make a pension fund’s board faint, and the answer comes back, cheerful and a little impatient:
“Sure, my all-in book took a brutal drawdown — but I made tons of money anyway.”
You can watch it happen in real time. The week I was finishing this, a trader with a large following posted that they were up triple digits on the year against the S&P’s single digits — and that a vicious early-June drawdown, made worse by too much leverage going into the sell-off, was just markets not always being easy. Leverage is beta with the mask off: a violent, structural drawdown reframed, cheerfully, as the texture of a winning year.


It isn’t a stupid argument, and that’s what makes it worth taking apart. The people saying it are often right that they made money, and the ones saying it loudest in any given year usually did. The problem is that “I made money” and “I was running a good process” are different claims, and microcaps are exactly the arena where the gap between them is widest and most expensive. This piece is about closing that gap, in three parts: how to keep score straight, how big to make each bet, and what shape the whole book should take. None of it requires a PhD — most of it is what professionals quietly internalize and amateurs never get told.
Let me start with the scoreboard, because everything else depends on it.
I. Keeping score straight
The first thing to understand is that volatility is not free. People treat it as the price of admission — the turbulence you tolerate on the way to a good number. But it’s not a side effect of the return; it’s a direct tax on it.
The arithmetic is unforgiving. Your compound return, the only one that actually shows up in your account, is roughly your average return minus half your variance. The bumpier the ride, the bigger that subtraction — two investors can have the same average annual return and end up in very different places, and the one who got there smoothly keeps more. And the recovery math is worse than people remember: a 50% drawdown doesn’t need a 50% gain to get back to even; it needs 100%. Down 67% needs a triple. The investor bragging about a great year rarely mentions that a chunk of it was clawed out of a hole he dug himself, and that two years of compounding got vaporized in the digging.
This is where “I made tons of money anyway” starts to wobble, but it really falls apart on a subtler point. The microcap communities I spend time in are, almost by definition, survivor pools. The people who sized wrong and got carried out aren’t in the chat posting screenshots — they’re quiet, or they’re gone. So “everyone here got rich being concentrated and long” is exactly what you’d observe even in a world where that approach has a terrible distribution of outcomes, because the bad draws are silent by construction. You’re looking at one path through a forest of paths, and the forest is full of people who didn’t make it out. Confusing the outcome with the quality of the bet is the original sin of microcap investing.
So if a single P&L line is a liar, what should we look at instead? The standard answer is the Sharpe ratio — your return divided by how much the portfolio bounced around to get there, so two investors who both earned 20% are not tied: the one who got there on a smoother ride scores higher. Its cousin, the Sortino ratio, counts only the downside bounces, on the logic that nobody loses sleep over upside volatility. Both are good instincts, and in microcaps both are dangerously incomplete — because they measure risk as volatility, and microcap volatility is systematically understated by stale prices. Illiquid names don’t reprint tick by tick; they sit, then jump. That smoothing makes realized volatility look lower than the real economic risk, so the most illiquid, most dangerous books often post the most flattering Sharpe ratios — a number that frequently agrees with the “I made money anyway” crowd. Worse, both ratios assume a roughly normal distribution, and microcap returns are the opposite: fat left tails, gap-down illiquidity events, the occasional permanent zero. A metric built on standard deviation simply cannot see the thing that actually kills these portfolios.
What I rely on instead is a family of measures that score risk the way it’s actually experienced — as the pain of being underwater. The bluntest needs no math at all: time to recovery, the longest stretch your portfolio ever spent below a prior high. This is the number that quietly dismantles the bragging because it exposes the part that gets edited out — that the “tons of money” include three years spent grinding back to where you already were.
For a single defensible number, I prefer the Ulcer index. Instead of hanging everything on the one worst day, it tracks how far below your prior peak you are at every point in time and takes the root-mean-square of that whole series. Two things fall out of that construction: it only ever looks at downside — being at a new high counts as zero, so unlike standard deviation, it never penalizes upside — and because of the squaring, it punishes drawdowns that are both deep and long, capturing the duration of suffering rather than just its depth. It’s also the measure least flattered by the stale-price smoothing that makes Sharpe lie. Finally, the Calmar ratio, compound return over worst peak-to-trough loss, is also worth knowing mostly because everyone cites it, but it hangs everything on a single observation, so one ugly week three years ago can dominate it.
All of these are backward-looking and path-dependent: they describe the road you traveled, not the distribution of roads you were exposed to, which loops right back to the survivorship point. A great realized Calmar can still be a lucky draw from a dangerous bet. But at least these numbers are scoring the right game.
II. How big?
Once you accept that volatility is a tax and that drawdowns are the thing that actually end careers, the next question is mechanical: how big do you make each position? Here, the microcap world has more wisdom than it gets credit for, scattered across a few practitioners who mostly disagree with each other — and the interesting part is how they disagree. (I’m naming names because the alternative online is wall-to-wall anonymous accounts posting screenshots no one can verify; the people I lean on are public personas with checkable backgrounds, so at least you can judge the source.)
The first is “Money Mark” Gomes — a technology equity analyst with a multi-decade career advising institutional funds, who now publishes his research for free. Two of his ideas are worth crediting. The first is the cylinders overlay: a stock only “deserves” full valuation if the business is firing on all cylinders; running on five of ten, its target sits halfway up — coupling your price target to operational execution instead of setting the two independently. The second is his profit-taking discipline — a family of methods, the most sophisticated scaling out into price spikes and overbought levels rather than at any fixed multiple. The throughline is a line he repeats often: once you’ve taken your initial investment back off the table, you can’t lose money on the position — behavioral medicine against round-tripping a winner.
Now set him next to Ian Cassel — founder of MicroCapClub and a full-time microcap investor for more than two decades, who runs a concentrated fund built around backing exceptional management teams. Cassel believes almost the opposite about scaling: high conviction doesn’t mean a big initial bet; concentration means letting winners get large at the end, not sizing big at the start. His largest positions all began small and earned their weight as the company proved itself quarter after quarter. He averages up. So you have a genuine practitioner disagreement: Gomes trims into strength to protect gains; Cassel adds into strength to ride them. Neither is wrong — they optimize different things. The trim rule improves the drawdown metrics from Part I at the cost of capping the right tail; the add-up rule does the reverse.
Underneath both sits a piece of math that deserves to be better known: the Kelly criterion, borrowed from gambling, which tells you the single position size that compounds your money fastest over the long run, given your edge and the payoff. The intuition is the useful part: bet less than Kelly says and you grow too slowly; bet more and a bad streak eventually wipes you out. But the real lesson isn’t the formula, it’s the haircut. Full Kelly assumes you know your edge precisely. You don’t — and in microcaps, where any name’s future return is a wild guess, you really don’t. So bet a fraction of what the formula suggests: “half-Kelly” gives up very little long-run growth while dramatically smoothing the ride, and in microcaps I’d go smaller still. “Size below your gut” isn’t timidity; it’s the correct response to not knowing your own edge as well as you feel you do.
And if you’re tempted to solve all this with a portfolio optimizer, the punchline is that in this corner of the market it usually makes things worse. The research is blunt: fed real-world estimates, an optimizer reliably underperforms a plain equal-weighted portfolio, because the errors in your inputs overwhelm whatever the optimization adds — and the costliest errors are in your return forecasts, the one number you can least estimate. Every serious fix amounts to the same move: trust your own forecasts less — precisely what fractional Kelly tells you to do, and what Cassel does when he refuses to size up until the company has earned it.
That’s the whole of Part II in one line. The fancy math and the practitioner's rules of thumb converge on a single humility: you cannot reliably predict which microcap wins, or by how much, so every credible approach is a way of not betting the farm on that guess. Start small, let reality confirm, cap what can hurt you.
III. The shape of the book
Sizing tells you how big each bet is. The last question is what the collection of bets should look like — and here microcap investors split into camps that rarely talk to each other. Small-cap only? Blend small with large? Or run long and short? The cleanest way in is a single picture I borrow from David Orr, who runs the Militia Capital long/short fund and the associated ORR ETF, and who states his strategy bluntly: less volatile stocks have higher returns, and small stocks have higher returns.
Orr shares a matrix — U.S. stocks sorted into a five-by-five grid by size and trailing volatility, with the long-run annualized return in each cell — and it reframes the whole debate. Read across the row of the smallest stocks, and the returns fall from around +17% in the calmest names all the way to negative in the wildest. The single best cell in the whole market and the single worst cell are both small caps. “Small caps outperform” is true only on average, and the average hides a brutal split: small-and-calm is the best real estate in equities; small-and-wild is the only place that loses money outright over half a century. The size premium itself inverts with volatility — in the calm column, small beats large by a wide margin; in the wild column, small trails large badly.


There’s a serious academic spine under that picture. The research on size and quality shows the raw size premium looks weak precisely because small companies tend to be “junky,” and once you control for quality, a large, robust premium emerges. Volatility is the cheap, observable proxy for junk — so Orr’s “small and low-volatility” is the academy’s “small and high-quality,” and his negative corner is their small-junk graveyard. And the low-volatility and lottery literature explains why the wild names don’t merely lag but actively bleed: investors systematically overpay for the tiny chance of a moonshot, so the most exciting names carry the worst expected returns. That’s the behavioral engine of this whole essay, stated as a factor.
Here’s the part that should stop the long-only microcap investor cold. The crowd believes that by owning small caps they’re harvesting the size premium. But the premium lives in the calm corner — and the names retail gravitates toward are the high-volatility story stocks, the lottery tickets, which sit in or near the corner that loses money. The very volatility behind “I made tons of money anyway” is, in small caps, a negative signal, not just an uncompensated one. Part I said volatility taxes compounding; Part III says that in microcaps, it can run the meter backwards.
That reframes the three camps cleanly. Small-only and long: the lesson isn’t “own small caps”; it’s “own the calm, high-quality corner and avoid the lottery names” — and you can capture most of the premium with no shorting at all. Blending small with large: large caps are mediocre everywhere on that grid, so adding them isn’t a return decision; it’s a drawdown-reduction trade you should make consciously rather than by default. Long/short, Orr’s full expression: long the calm corner, short the lottery corner, hedge out the market — the highest theoretical reward-per-unit-of-pain, and the reason a book like his can post a high Sharpe at a contained drawdown while running serious gross leverage.
I won’t oversell the backtest. The calm small-cap corner is the least liquid in the market, so capturing those returns at scale is impossible — which is why Orr’s fund closes to new money and why he says the ETF can’t even short the same names as the hedge fund. The short leg is far less harvestable than the coloring implies: hard-to-borrow, squeeze-prone names with unbounded tails. And the low-volatility trade has been heavily arbitraged since min-vol ETFs went mainstream, so a multi-decade backtest front-loads the era before the trade was known. The picture is a map of where returns lived, not a portfolio you can simply buy.
Which brings me to the philosophy that sits in direct tension with Orr’s diversified machine: Stanley Druckenmiller’s “put all your eggs in one basket and watch the basket very carefully.” Most people quote the wrong half — the risk model is in the watching. His case for concentration is about attention: the trouble starts when you’re spread across thirty-five or forty names, whereas a big position has your full focus. He pairs it with Soros’s lesson that what matters isn’t your hit rate but the asymmetry between what you make when right and what you lose when wrong, and with a ruthless willingness to cut the moment the thesis breaks. “It takes courage to be a pig” — but strip out the watching and the cutting and you don’t have his philosophy, you have the romantic fragment that gets people killed.
So which is right — Orr’s breadth or Druckenmiller’s depth? The cleanest reconciliation is a piece of math, the fundamental law of active management: your risk-adjusted return is roughly your skill per bet times the square root of the number of independent bets. That single relationship contains both men. Druckenmiller is enormous skill per bet and very few bets — by his own account, the conditions for a real concentrated wager appear once or twice a year. Orr is modest skill per bet and an enormous number of them. They aren’t disagreeing about what’s correct; they occupy opposite corners of the same equation, and concentration and diversification are substitutes for manufacturing the same result.
The catch — and this is where I’d push back on “just do deeper research” — is the word independent. Forty microcap longs aren’t forty independent bets if they all load on the same liquidity, size and sentiment factors; in a risk-off week they fall together, and your effective breadth is a fraction of forty. A long-only book can land in the worst of both worlds: neither the deep idiosyncratic edge that justifies concentration nor the genuine independence that makes diversification pay. This is why Orr engineers independence on purpose — global names, a short book uncorrelated to the longs, near-zero beta. He isn’t diversified for comfort; he’s diversified because a modest-edge strategy only works if the breadth is real. You don’t have to take that on faith: in June 2026 he posted that one partition of his hedge fund was down 24% before fees while the fund overall was still up 18% net on the year, and he himself was roughly flat — a book taking a violent hit in one corner and still holding at the top level, because the pieces aren’t all the same bet wearing different tickers.
And there’s a microcap-specific reason to be careful with Druckenmiller worship. He forged “watch the basket carefully” in macro — the most liquid arena on earth, where you can exit an enormous position in an afternoon. In illiquid microcaps, the watching half still works, but the acting half is structurally broken: you can monitor a thesis-breaking development all you like, but you can’t exit a position worth twenty days of volume once the basket cracks. A blowup in a name you can’t sell — a fraud, a dilutive raise, a binary that breaks the wrong way, all routine here — is a single-path event you may not recover from. The synthesis, happily, already exists, and it’s Cassel’s. “Let winners earn their size” is “all eggs in one basket, watch it carefully” rebuilt for illiquidity: you don’t start concentrated, you let conviction plus realized execution concentrate the book over time, so you only end up large in names that have proven themselves — and that have usually become more liquid as they re-rated, so the exit is actually operable when you need it. Orr at one end, pure concentration at the other, Cassel as the bridge most of us can actually walk across.
A worked example: the conference darlings
Theory is easy to nod along to and hard to act on, so let me make it concrete with a basket I suspect a lot of readers actually own. Each year, the Planet MicroCap conference publishes, in effect, a popularity ranking — the companies that drew the most investor meeting requests. The most recent runs to names like Amtech Systems, Pro-Dex, M-tron Industries, Armanino Foods, Energous, Mama’s Creations, 5E Advanced Materials, Eco Wave Power, and dozens more. Plenty of microcap investors hold a dozen of these at once and call it a portfolio. Let’s take that portfolio and try not to get killed with it.


(Everything below is a hypothetical illustration of method — not advice, and not a view on any of these companies. Sort them yourself, with current numbers.)
Start with the uncomfortable observation from Part III. A “most-requested” list is an attention ranking, and attention is the lottery factor — the exact thing that lands a name in the dangerous corner of Orr’s grid. So a portfolio built from conference buzz is, almost by construction, tilted toward the quadrant with the worst long-run expectancy. That doesn’t make it a bad list; it makes it a concentrated bet on sentiment wearing the costume of a diversified book.
The first move is triage, on the key Part III handed us: calm, cash-generative quality on one side, pre-revenue story on the other. The list spans both — genuinely profitable, slower-compounding businesses (the unglamorous food makers and niche component manufacturers that throw off cash and don’t lurch 8% on a tweet) at one end, and pure stories (the wireless-power, wave-energy, and development-stage-materials names on the same list) at the other, where the whole thesis is a someday. Owning ten of the second kind isn’t diversification; it’s ten lottery tickets that all cash or expire on the same macro days.
Now build the thing so it survives. Three moves, one from each part of this essay.
Size by tier, and cap the casino. The quality core earns the larger weights and gets built up over time as each name executes — Cassel’s rule. The story sleeve gets small, fractional-Kelly-sized positions and, crucially, a collective cap. Ten 2% lottery tickets isn’t ten small bets; it’s a 20% bet on the sentiment factor, because they all move together. Cap the whole speculative sleeve at a number you could watch go to zero without it ending you.
Add ballast you can actually sell. A slug of liquid large caps does two jobs: it dilutes the small-cap concentration, and it gives you something you can liquidate in an afternoon when the microcap book locks up. One nuance: the Mag7 are liquid but not low-beta. If you want the ballast to genuinely dampen volatility rather than just provide an exit, large industrials and defensives do more of that work than the megacap-growth names.
Short the factor you have no edge on. This is the Orr route proper, and the move that matters most. Your edge, if you have one, is picking which microcaps are mispriced — not whether small caps as a class go up next quarter. So strip out the part you can’t forecast: short the small-cap index against the book. A short in IWM (the Russell 2000), or its inverse RWM if you can’t short, neutralizes the shared small-cap beta that makes twenty names behave like one — the same standing hedge Mark Gomes prescribes to retail, arriving at Orr’s conclusion from the opposite, bottom-up direction. Size the shorts to bring net exposure and beta down to a level you decided on in advance: not to zero, unless you want Orr’s near-market-neutral profile, but down.
Here’s the before-and-after, in round, illustrative numbers:
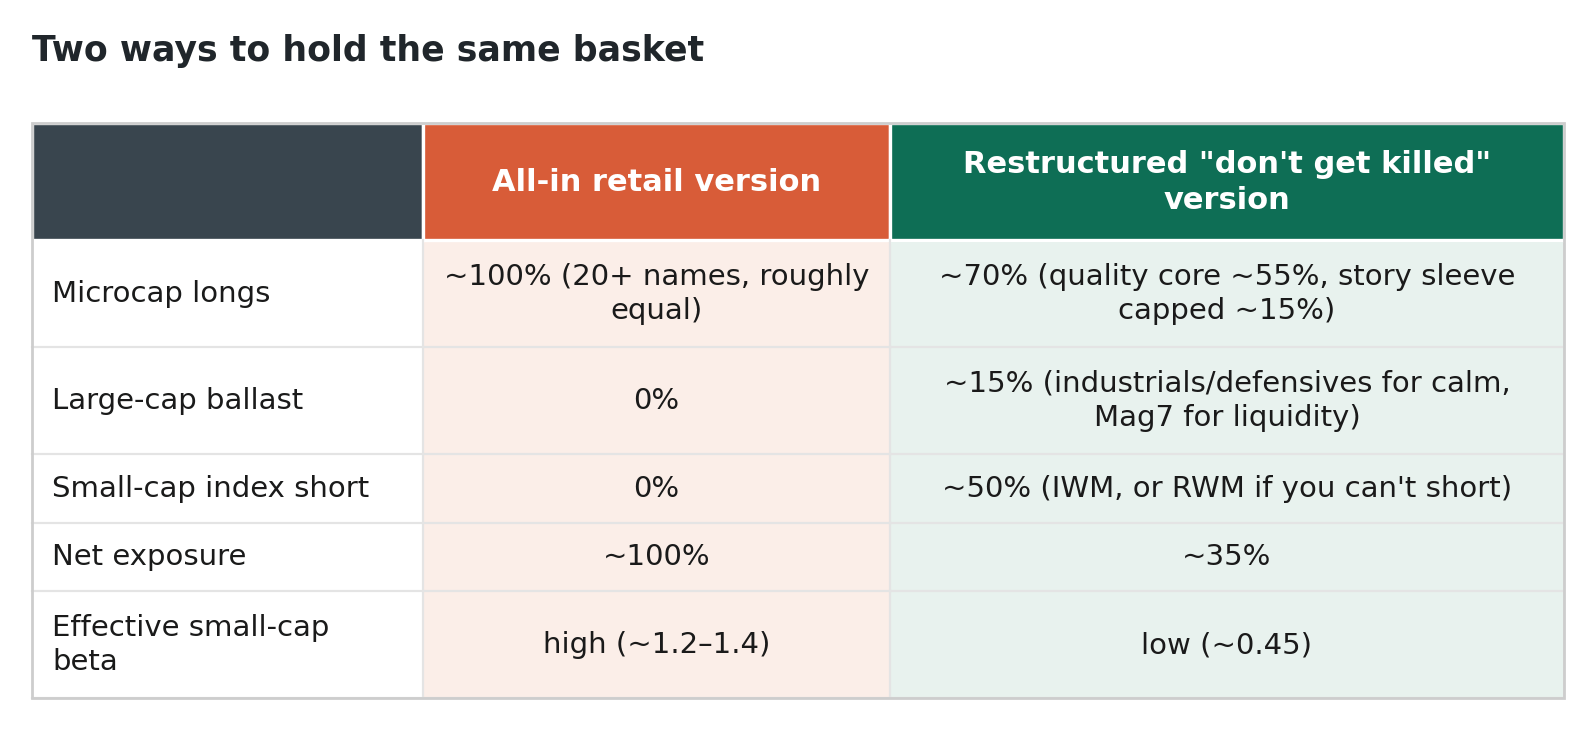
The arithmetic of the hedge is the whole point. If your longs drop 20% and your index short rises 20%, the short eats most of the loss, and what’s left is your stock selection — the only thing you ever had an edge on. You’ve thrown away the beta you couldn’t forecast and kept the alpha you might have. In the language of Part I, you’ve traded some right-tail upside — in a small-cap melt-up this book will lag, badly, and you have to make peace with that — for a shallower drawdown, a lower Ulcer index, and a recovery measured in months instead of years.

Each dot is one day of a simulated year. The hedge flattens the slope from roughly 1.3 to under 0.5 — you have thrown away most of the market move you can’t forecast and kept your stock-specific result.
So does the restructure actually pay off? You can’t answer with a single backtest — one real year is a sample of one, the exact error Part I warns against — so I simulated four thousand plausible one-year paths for each book. Crucially, both books hold the same longs: the same twenty-odd microcaps, the same genuine stock-selection edge. Microcaps do carry alpha and I won’t pretend they don’t — the all-in book simply owns more of it, unhedged; the restructured book owns less and hedges the market exposure away. Every assumption lives in the code and is yours to challenge.
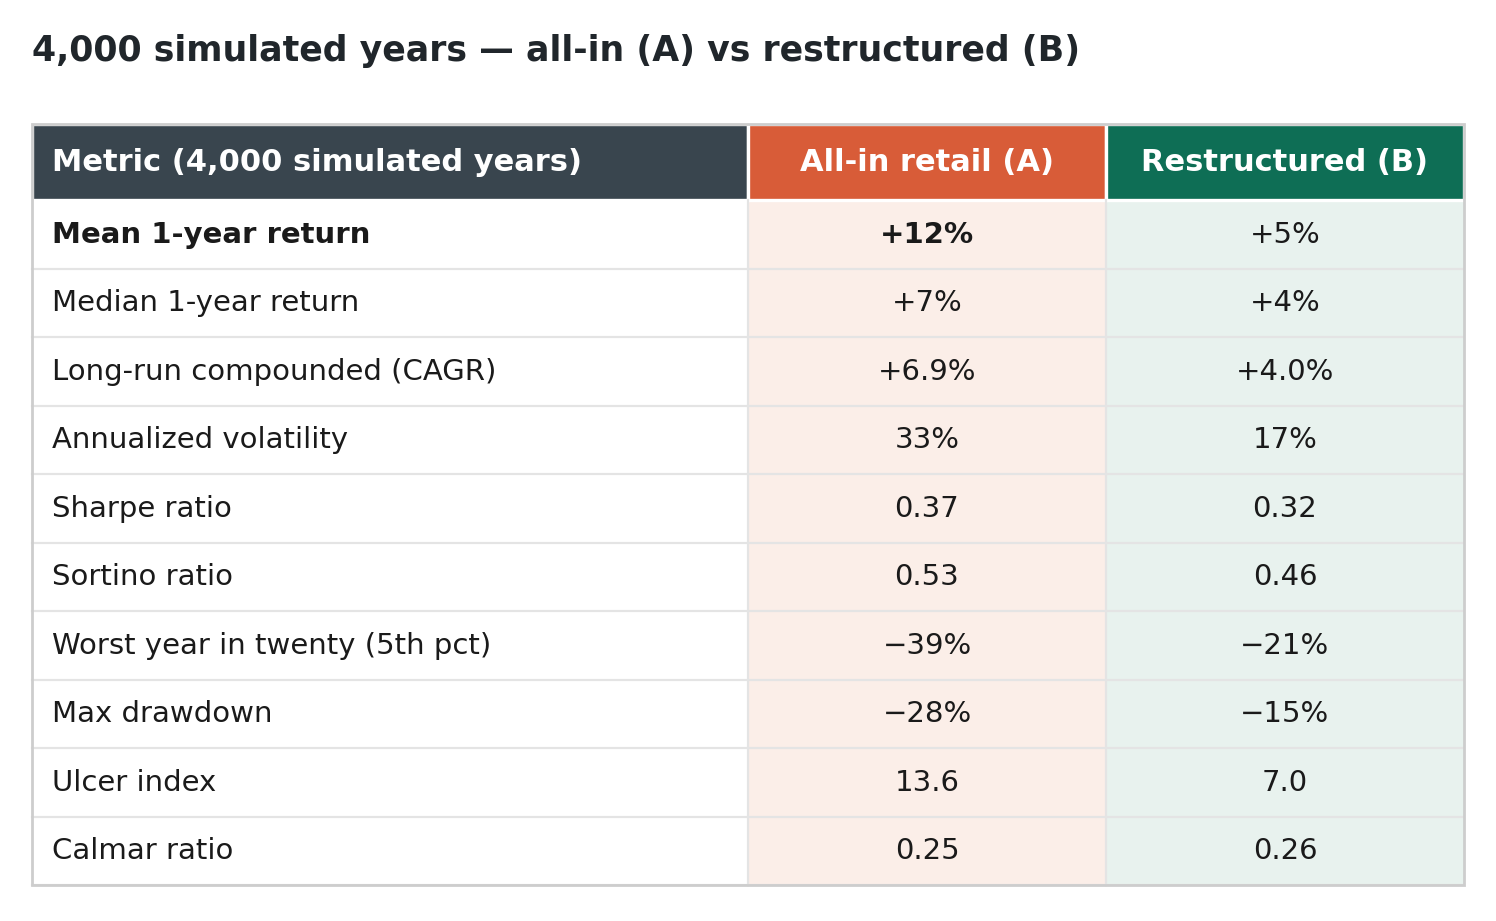
Read the top of that table, and the all-in book is the obvious winner: more on average, more in the median year, more compounded over time, and it even edges the restructured book on Sharpe. If you optimize for expected return — the thing every brokerage statement and group-chat brag puts front and center — you should hold it, full stop. So why give it up? Because expected return is the wrong thing to maximize, and the bottom of the table is the reason. Three arguments, each a way of saying the average is not the outcome.
One: you don’t live the average; you live one path through it. The cleanest way to feel this is a coin. Heads, your stake grows 50%; tails, it shrinks 40%. The average outcome of a single flip is +5% — a wonderful bet, on paper. Now play it with your whole net worth, flip after flip. You go broke, almost surely, bleeding roughly 5% of your wealth per flip — because what compounds is not the average of the outcomes but their product, and √(1.5 × 0.6) is less than one. The arithmetic mean is a fact about a thousand parallel versions of you; the geometric reality is what happens to the single one of you walking forward in time. The all-in book is a far gentler coin, but the same wedge is there: its +12% average compounds to under +7% lived — the volatility tax from Part I, paid in full.
Two: the average belongs to the lucky few. Run twenty thousand investors through twenty years of the same all-in book and watch where they land.

Twenty thousand investors, twenty years, the identical book. Left: the all-in book’s “average” ends near 9× — but the average is the dashed line floating above almost everyone, dragged up by a handful of lucky paths at the top. The typical (median) investor ends near 3×, and the unlucky fifth-percentile investor ends below a third of where they started. Right: the restructured book’s mean and median nearly touch — its humbler advertised number is roughly the number you actually get.
The all-in book advertises a +12% average and a 9× twenty-year outcome, but that gaudy mean is earned by the bright threads at the top of the fan — the lucky paths almost nobody is on. The restructured book makes a humbler promise and roughly keeps it, because there’s no fat tail of luck doing the talking.
Three: the far left tail does not average out, because it ends the game. The all-in book’s unlucky investor finishes twenty years at a quarter of their capital. On a spreadsheet that’s one bad cell among thousands; in a life it’s a margin call in the wrong week, a redemption notice, a forced sale to cover a tuition bill — or simply the night you couldn’t take the −40% any longer and sold the low. The +12% average quietly assumes you held like a machine through every one of those moments, and you won’t. The restructured book truncates that tail — a −15% drawdown instead of −28%, a −21% worst year instead of −39% — not because it’s cleverer, but because surviving the path is the precondition for ever collecting the average.
So the real case for restructuring isn’t that it makes you richer. Told straight, it usually doesn’t: the all-in book, held with inhuman discipline through everything, would likely leave you wealthier at the median. The case is that “held through everything” is a fantasy for almost all of us, and a higher average return is worth nothing to an investor who isn’t standing at the finish line to collect it. You’re trading some expected return for a far higher probability of still being in the game to compound at all. In microcaps, where drawdowns are violent and exits jam shut precisely when you need them, that’s usually the right trade. “I made tons of money anyway” is the sentence of someone reading the mean off the top of the fan; the only question that matters is whether you’ll be on the path that earned it.
And the caveats, because a hedge is not a force field. Shorting costs money: borrow fees, financing and dividend drag on an index short, the risk of a squeeze in a rip. Inverse ETFs like RWM decay if you hold them through chop. Worst of all, the hedge is imperfect exactly when you need it most — in a real liquidity panic, microcaps fall more than the index, so an IWM short under-hedges the tail. I get into all this in a companion piece, Shorting Microcaps Without Getting Killed: why a single-name dilution, not a broad selloff, usually takes your face off, and the three gates any deliberate short has to clear before it’s worth the rent. None of that argues against hedging; it argues for sizing the hedge with the same humility as everything else, and never believing structure is a substitute for owning fewer lottery tickets in the first place.
“But I made tons of money anyway”
A sharp reader has been waiting to say it since the first paragraph: I rode an all-in microcap book through a brutal drawdown and came out far richer. So what’s the problem? Both halves are usually true — and they reconcile once you see that “retail” is not one investor but at least two: a skilled minority with a real, durable edge, and the roughly four-in-five who simply long high-beta momentum with no edge at all, piling into whichever small, jumpy stocks have lately run up the most. Run all three books — yours, theirs, and the hedged version of yours — through the same markets, then sort the years by what the market did:
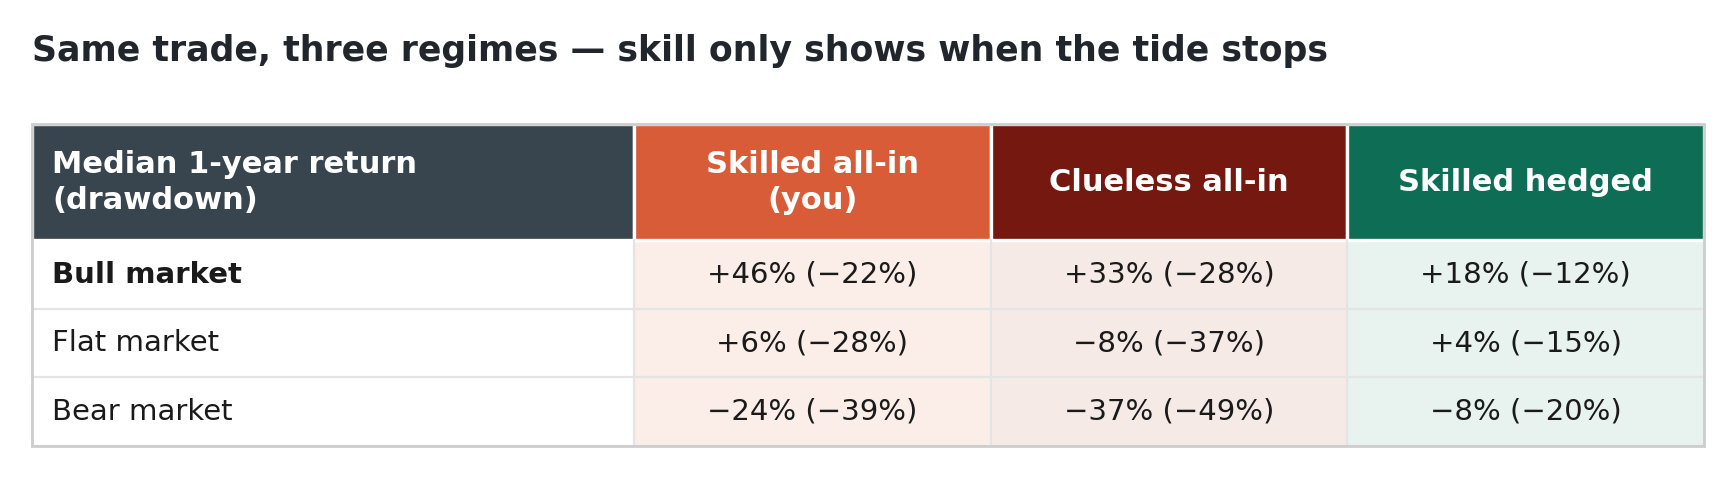
The top row is the entire answer. In a bull, the no-edge book made +33% with a −28% drawdown — nearly matching the skilled book’s +46%. “Huge drawdown, tons of money” is the signature of high beta in a rising market, worn by the skilled and the clueless alike. Decompose a +25% small-cap year, and you see why: of your roughly +38%, about 32 points were beta — the regime — and only about 6 were edge. The clueless investor’s gain was beta and nothing else. Most of everyone’s “tons of money” was the tide — precisely what the hedge throws overboard.

Same three investors, three regimes. In the bull, the no-edge book ≈ the skilled book — both “huge drawdown, tons of money.” Skill and structure only become visible when the tide stops lifting everyone.
The edge shows up only where the tide isn’t carrying everyone — flat and down — and over a lifetime it becomes the whole story. Compound twenty years of these regimes and the skilled all-in book grows near +6% a year, to roughly 3× your money; the identical-looking clueless all-in book compounds at −8% — a median of one-fifth your starting stake and a roughly seven-in-ten chance of finishing below half. Same trade, same bragging in the same bull market, opposite destinies — because one book has an edge underneath the beta and the other has only the beta.
So “I made tons of money anyway” quietly hides three things: survivorship (the bear-market blow-ups don’t post — the 70% on their way to ruin go silent, and the chat fills with winners), beta worn as skill (in a bull the two all-in books are indistinguishable on the P&L, and it’s the edgeless crowd that repeats the line loudest, then sizes up right before the regime corrects them), and timing, not survival (that you held through this drawdown says nothing about the −40% that lands the week you face a margin call).
If you’re the skilled investor, the all-in book is genuinely defensible — your alpha is real, you can hold, and you may well end up wealthier than the hedged version of yourself. The trouble is that your sentence sounds exactly the same coming from the four-in-five who have neither the edge nor the staying power, and the market is the only thing that ever tells you apart. “Tons of money anyway” means the market went up and you were levered to it. Everything in this essay is about the years it doesn’t.
The verdict
Strip away the names and the math and a single idea runs through all three parts. Risk in microcaps is not the discomfort you endure on the way to a return — it is information, and most investors are misreading it.
• Keep score on the right thing. Not the size of the number, but whether the process that produced it could survive being run again. Volatility is a tax on compounding; drawdown duration is what ends careers; a single great year is a sample of one.
• Size for your ignorance, not your conviction. You cannot predict which microcap wins or by how much, so start small, let reality confirm, and cap what can hurt you. Every serious framework, from Kelly to Cassel to the failure of the optimizer, is a different way of saying the same thing.
• Mind the shape, not just the names. In microcaps, high volatility is not an uncompensated risk — it has historically been a negative-expectancy risk. The premium lives in the calm, high-quality corner; the graveyard is full of lottery tickets. Whether you express that long-only, blended, or long/short is a choice about your edge and your liquidity, not your courage.
“I made tons of money anyway” might even be true. But it’s an answer to the wrong question. The right question is whether you’d want to live every path that bet could have produced — and in microcaps, the difference between the path you got and the ones you didn’t is the whole game.
Nothing here is investment advice; it’s how I think about my own book, and I’d rather be useful than right. As always, push back — that’s what the comments are for.